OpenTelemetry Integration
OpenTelemetry provides observability APIs and instrumentation for applications. oRPC integrates seamlessly with OpenTelemetry to instrument your APIs for distributed tracing.
WARNING
This guide assumes familiarity with OpenTelemetry. Review the official documentation if needed.
INFO
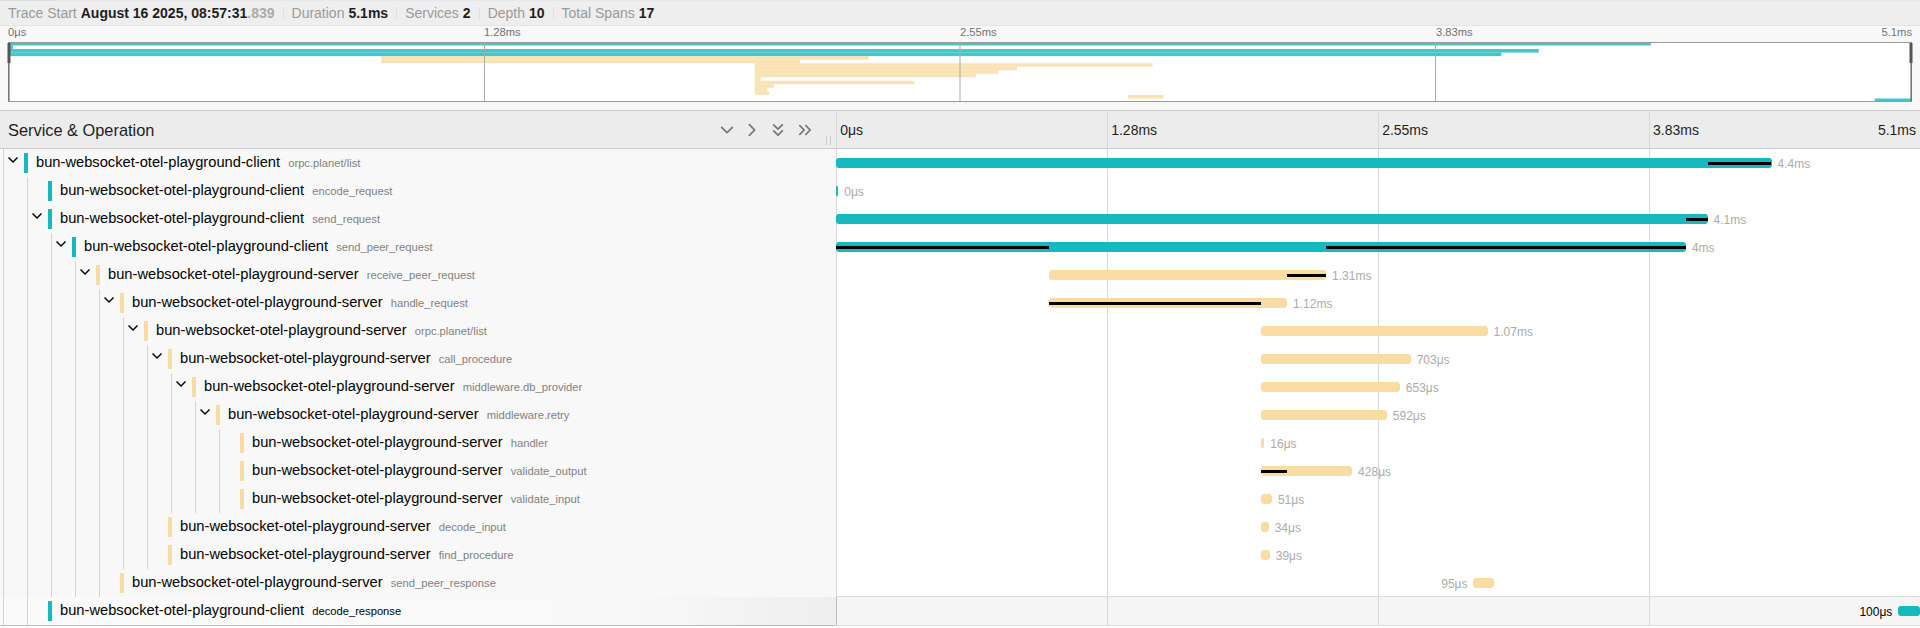
See the complete example in our Bun WebSocket + OpenTelemetry Playground.
Installation
npm install @orpc/otel@latestyarn add @orpc/otel@latestpnpm add @orpc/otel@latestbun add @orpc/otel@latestdeno add npm:@orpc/otel@latestSetup
To set up OpenTelemetry with oRPC, use the ORPCInstrumentation class. This class automatically instruments your oRPC client and server for distributed tracing.
import { NodeSDK } from '@opentelemetry/sdk-node'
import { ORPCInstrumentation } from '@orpc/otel'

const sdk = new NodeSDK({
  instrumentations: [
    new ORPCInstrumentation(),
  ],
})

sdk.start()import { WebTracerProvider } from '@opentelemetry/sdk-trace-web'
import { registerInstrumentations } from '@opentelemetry/instrumentation'
import { ORPCInstrumentation } from '@orpc/otel'
const provider = new WebTracerProvider()
provider.register()
registerInstrumentations({
instrumentations: [
new ORPCInstrumentation(),
],
})INFO
While OpenTelemetry can be used on both server and client sides, using it on the server only is sufficient in most cases.
Middleware Span
oRPC automatically creates spans for each middleware execution. You can access the active span to customize attributes, events, and other span data:
import { trace } from '@opentelemetry/api'

export const someMiddleware = os.middleware(async (ctx, next) => {
  const span = trace.getActiveSpan()

  span?.setAttribute('someAttribute', 'someValue')
  span?.addEvent('someEvent')

  return next()
})

Object.defineProperty(someMiddleware, 'name', {
  value: 'someName',
})
TIP
Define the name property on your middleware to improve span naming and make traces easier to read.
Handling Uncaught Exceptions
oRPC may throw errors before they reach the error handling layer, such as invalid WebSocket messages or adapter interceptor errors. We recommend capturing these errors:
import { SpanStatusCode, trace } from '@opentelemetry/api'

const tracer = trace.getTracer('uncaught-errors')

function recordError(eventName: string, reason: unknown) {
  const span = tracer.startSpan(eventName)
  const message = String(reason)

  if (reason instanceof Error) {
    span.recordException(reason)
  }
  else {
    span.recordException({ message })
  }

  span.setStatus({ code: SpanStatusCode.ERROR, message })
  span.end()
}

process.on('uncaughtException', (reason) => {
  recordError('uncaughtException', reason)
  // process.exit(1) // uncomment to restore default Node.js behavior
})

process.on('unhandledRejection', (reason) => {
  recordError('unhandledRejection', reason)
  // process.exit(1) // uncomment to restore default Node.js behavior
})
Capture Abort Signals
If your application heavily uses Event Iterator or similar streaming patterns, we recommend capturing an event when the signal is aborted to properly track and detach unexpected long-running operations:
import { trace } from '@opentelemetry/api'

const handler = new RPCHandler(router, {
  interceptors: [
    ({ request, next }) => {
      const span = trace.getActiveSpan()

      request.signal?.addEventListener('abort', () => {
        span?.addEvent('aborted', { reason: String(request.signal?.reason) })
      })

      return next()
    },
  ],
})
Context Propagation
When using oRPC with HTTP/fetch adapters, you should set up proper HTTP instrumentation for context propagation on both client and server. This ensures trace context propagates between services, maintaining distributed tracing integrity.
INFO
Common libraries for HTTP instrumentation include @hono/otel, @opentelemetry/instrumentation-http, @opentelemetry/instrumentation-fetch, etc.